With plenty of data can be a stroke of luck as much as it is a torment. Marketers now have plenty of data that can be used to back up their plans and strategies. This will also mean that they will have to go through a very tiring and frustrating process of sifting through the sea of data, to find what they may need to evaluate success and what might help them build a case for their work’s worth. This may lead to analysis paralysis where they get overwhelmed with data and end up not making even a single decision.
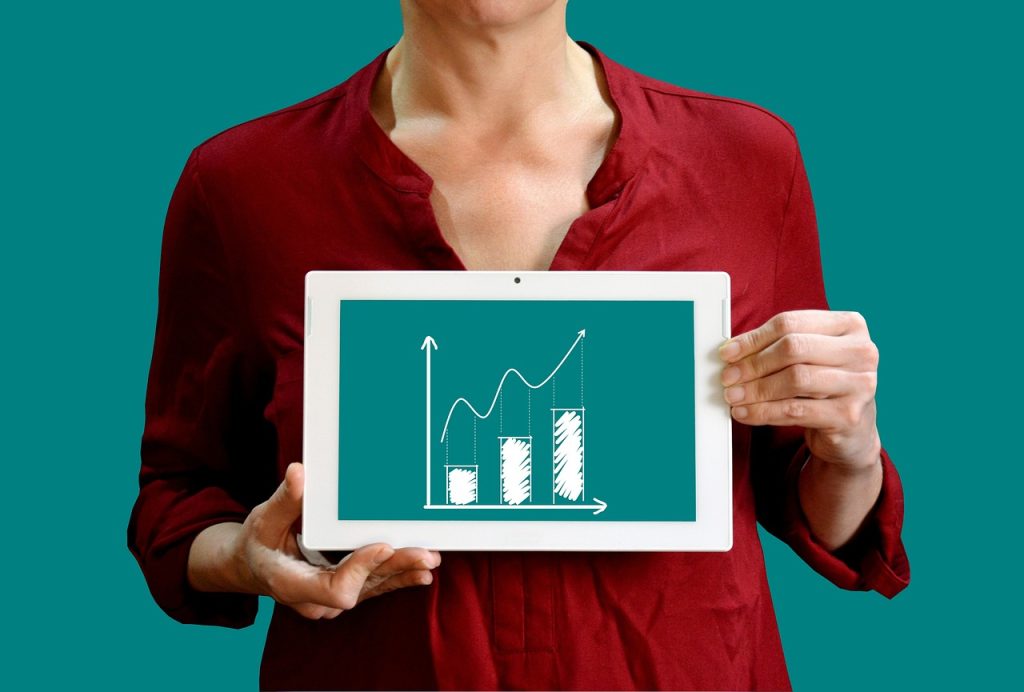
This is where Data visualization steps in. It makes the information easier to process and understand by presenting the most critical information in a visual manner.
In this blog, I will give you an in-depth look at what Data Visualization is and its Importance in digital marketing.
What is Data Visualization?
Data visualization is the process of converting enormous and complex datasets into a visual format. The visuals, not only make your data more understandable but also make it look more appealing and may help in capturing people’s attention quickly.
Importance of Data Visualization in Digital Marketing
It is now evident that many people have encountered different visualization elements such as charts and graphs. As a digital marketer, you will need an excellent marketing strategy to win yourself a considerable number of potential clients.
Most digital marketers may experience difficulty in gaining the trust of the targeted audience and this may hinder businesses from growing and not attaining their goals. The use of data visualization may help their business attain their goals. Now let’s know what are the importances in detail, let’s roll together.
Easy to Present Data
As a digital marketer data visualization gives you space in exploring and presenting meaningful information systematically to your audience. Graphs, charts tables, and other data visualization elements may help you convey the information in a more understandable manner. In addition to that, the information is also presented in an appealing way and this grabs the attention of the audience. With data visualization as a digital marketer, you are able to present your information to people speaking different languages and this won’t be an issue since the message presented in visuals is universal and everyone can understand the message.
Data visualization goes beyond words since everyone gets a deep understanding of every message displayed. As a digital marketer, the message places your business at a competitive edge since it is persuasive in nature.
Process Huge Sets of Data
Research has disclosed that businesses generate a lot of data from their daily operations. With data visualization as a digital marketer, you are able to analyze the data and bring about essential insights that are worthy of the growth of your business. You can also use data visualization to compare specific patterns and trends in digital marketing by creating insightful visualization using tools such as Tableau, Anychart, ChartExpo, and GoogleCharts.
By processing huge sets of data as a digital marketer you can easily identify the main aspect essential in convincing your potential customers to make your business a priority.
Engage the Audience
As a digital marketer, customer engagement is essential for your business. According to research, 80% of businesses that focus on enhancing customer engagement succeed more than others. Using the right visuals will enable your target audience to have a clear view of the major points of your campaigns.
Incorporating aspects such as data storytelling makes your campaigns more successful. For example, using the data to tell stories about your business within a specific time.
The use of graphics also encourages customer engagement bringing success to your business. With that customers get the confidence in buying your products and services.
Improves your Decision-Making Process
As a digital marketer data visualization helps you make the right decisions by providing better insights and understanding. You will not have to comb through data to get the information you need and you are able to avoid blind spots and make the right decisions faster.
It allows you to create effective ideas and campaigns before your competitors do.
Helps Identify Trends in the Industry
Every business operates depending on the current trends within the business industry. Before structuring your content marketing as a digital marketer it is very important to do analytics and identify the current trends within your business industry.
Presenting your data in graphs and charts as a digital marketer you get a clear picture of the exact situation across the industry, and you get the idea about how you need to modify your content marketing campaigns to elevate the performance of your business.
As a digital marketer, you need to stay updated about the ongoing changes to make unique content marketing campaigns that will work for your business since the business industry keeps on changing.
Easily Repurposed
Versatility is one of the best features of data visualization since it allows you as a digital marketer to repurpose it in different formats for various aspects of your business, be it from social media to content marketing.
It helps in translating the information into a format that is easier to process and understand the crucial metrics at every level. It becomes perfect for use in internal reporting and client reporting as well as content development. Visualized data makes your content easier to use and share, especially on social media where visual content leads.
Bottom Line
From what we have learned so far, it is clear that data visualization is essential in every business. Not only for marketing but, for better communication within the business and for better and quicker decisions. It also serves your content marketing efforts in so many ways with the versatility to adapt to various formats.